用户指南 (User Guide)
本章节是使用 GdiSDK 进行应用开发的「进阶手册」,侧重于 工作流 (Pipeline) 和 模块 (Module) 的整体设计思路与最佳实践。
和 新手入门 (Getting Started) 相比,本章节更偏向「架构级」的说明,帮助你从整体上理解:
如何把一系列模块组织成可复用的 Pipeline 应用
如何为 Pipeline / 模块设计 UI 交互
如何把 Pipeline 上传到 GDIM 平台供他人使用
什么是GDIM?
GDIM (Geo Data Intelligence Management) 是面向地学与环境领域的专业数据智能平台,涵盖岩土工程、土壤与地下水、资源与矿产等场景,支持从数据到报告的一体化数字工作流。
在本手册中,你可以简单地把 GDIM 理解为:
数据与项目的统一载体:所有钻孔数据、试验数据、项目属性等,都以统一的数据结构保存;
应用的运行环境:你用 GdiSDK 开发的 Pipeline,可以被打包成「应用」,在 GDIM 上被不同用户配置和运行;
工作流使用平台:GDIM 提供自动报告、数据对接、数据分析等多种应用形态,底层都依赖 Pipeline 机制。
GdiSDK 的定位是:让熟悉业务的工程师可以用 Python + 工作流的方式自助搭建应用,而无需从零写一整套 Web 前后端系统。
什么是工作流 (Pipeline)?
在 GdiSDK 中,Pipeline(工作流)就是一个可以被反复执行的“数据处理应用”:
由若干 模块 (Module) 组成,每个模块完成一件清晰的小事;
模块之间通过 端口 (Port) 传递数据;
模块之间的连接关系构成 数据流 (Data Flow);
整个 Pipeline 的元信息(名称、版本、属性、返回结果)可以被保存为
.pipe文件,并在 GDIM 中作为应用运行。
一个最简单的 Pipeline 结构大致如下:
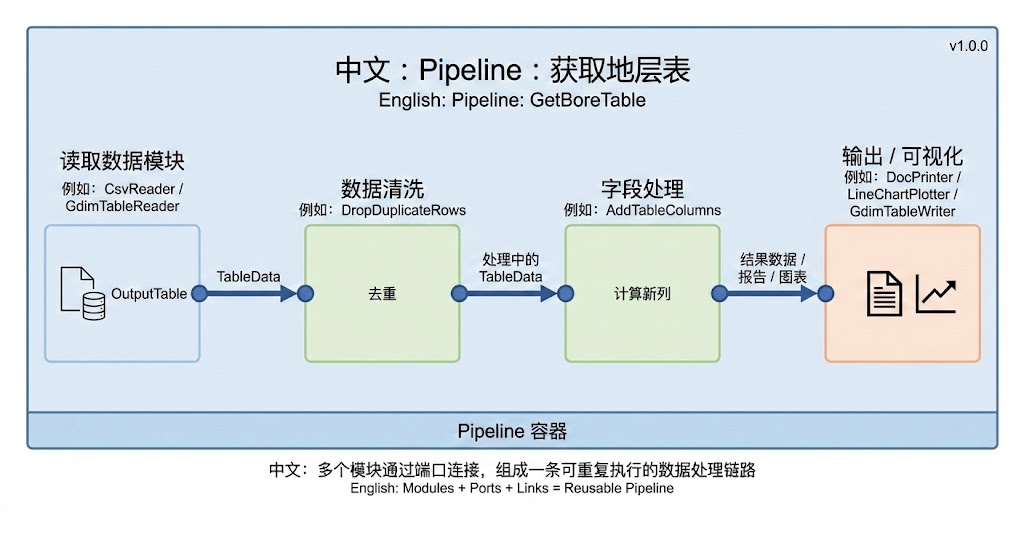
从开发者的视角看,一个典型的 Pipeline 至少包含三类模块:
数据读取模块:例如
CsvReader、GdimTableReader、GdimAppDataReader``(读取其它应用经 ``save_data_to_db落库的数据)等,用于从文件或 GDIM 项目中读取数据;数据处理模块:如过滤、转换、统计、拟合、绘图等模块;
输出模块:例如写入 GDIM 表、生成 Word 报告、绘图模块等。
下面是一个极简示例,展示如何用 GdiSDK 创建并运行一个本地 Pipeline(详细说明可以参考 新手入门 (Getting Started) 中的入门案例):
from gdisdk.modules.readers import CsvReader
from gdisdk.modules.filters import DropDuplicateRows
from gdisdk.modules.operators import AddTableColumns
from gdisdk.pipeline.pipeline import PipeLine

# 1. 实例化模块
read_csv = CsvReader(mname="ReadCsv")
read_csv.file = "地层表.csv"

drop_duplicate = DropDuplicateRows(mname="DropDuplicate")
drop_duplicate.subset = ["bore_number"]

add_column = AddTableColumns(mname="AddColumn")
add_column.column_names = [
    {"name": "layer_name", "title": "layer_name", "unit": "-"}
]
add_column.column_templates = {"layer_name": "{layer_number} + {material_name}"}

# 2. 创建 Pipeline
pipeline = PipeLine(app_name="GetBoreTable", app_title="获取地层表")

# 3. 使用 >> 和 | 连接模块端口
links = (
    read_csv.OutputTable >> drop_duplicate.InputTable
    | drop_duplicate.OutputTable >> add_column.InputTable
)

# 4. 添加到 Pipeline 并运行
pipeline.add_links(links)
pipeline.run()

# 5. 读取最后一个模块的输出
print(add_column.OutputTable.data.head())
如果你需要让 多个 GDIM 应用 串联成业务链(上游落库、下游读回),可在上游构建 Pipeline 时使用 save_data_to_db() 登记要持久化到项目库的端口或参数;在下游应用中使用 GdimAppDataReader 与 GdimAppDataSelector 取回数据。键名规则与配置细节见 运行机制 (Runtime);具体示例见 modules.readers 模块帮助 与 modules.filters 模块帮助。
若需要在**同一个 Pipeline 内**对多组数据重复执行同一子流程,参见 流程控制 (Flow Control)。
什么是模块 (Module)?
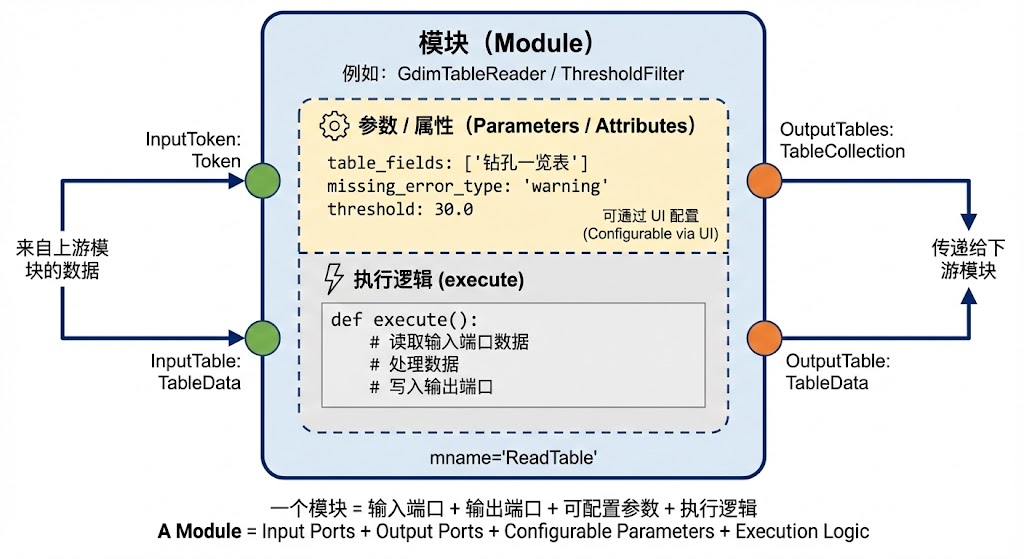
模块 (Module) 是 GdiSDK 工作流中的最小功能单元。可以把它想象成「一个有输入、有输出、可配置参数的小型算法组件」:
输入端口 (Input Ports):从其他模块接收数据;
输出端口 (Output Ports):将当前模块的处理结果输出给后续模块;
参数 / 属性 (Attributes):控制模块行为,例如文件路径、过滤条件、模型参数等;
执行逻辑 (execute):真正完成业务计算的 Python 代码。
概念上,一个模块可以画成下面这样:
从开发者角度看,一个典型模块会:
继承
PipeModule基类;使用
PortReference[PortTypeHint.xxx]声明输入/输出端口;用
_port_docs字典给每个端口写清楚文档说明;在
__init__中定义可配置参数,并设置_title/_description方便 UI 展示;可选实现
update_ui_schema方法,告诉系统如何为模块参数生成 UI 控件;在
execute方法中读写端口数据,实现业务逻辑。
以下示例基于 gdisdk.modules.readers 中的部分模式,展示一个极简「读取 GDIM 文件对象」的模块结构(为讲解做了简化):
from gdisdk.pipeline.pipeline import PipeModule, PortReference, module_decorator
from gdisdk.pipeline.portTypes import PortTypeHint
from gdisdk.pipeline.pipeData import FileAttributeSchema, UIAttributeSchema


@module_decorator()
class GetGdimFile(PipeModule):
    """从 GDIM 文件服务器获取文件对象。"""

    # 声明输出端口:类型为 GdimFile
    OutputGdimFile: PortReference[PortTypeHint.GdimFile]

    # 端口说明(用于文档和 UI)
    _port_docs = {"OutputGdimFile": "GDIM 文件对象。"}

    def __init__(
        self,
        mname: str | None = None,
        auto_run: bool = True,
        gdim_file: dict | None = None,
    ) -> None:
        super().__init__(mname=mname, auto_run=auto_run)

        self.gdim_file = gdim_file
        self._title = "获取GDIM文件"
        self._description = "从GDIM文件服务器获取文件对象"

    def update_ui_schema(self, reset: bool = False) -> dict[str, UIAttributeSchema]:
        # 定义一个文件选择控件,用于在 UI 中配置 gdim_file
        return {
            "gdim_file": FileAttributeSchema(title="GDIM文件数据"),
        }

    def execute(self) -> PortTypeHint.GdimFile | None:
        if self.gdim_file is None:
            self._ports_out["OutputGdimFile"].data = None
            return None

        # 这里省略 gdim_file 解析细节...
        file_obj = ...
        self._ports_out["OutputGdimFile"].data = file_obj
        return file_obj
Note
示例中使用了
@module_decorator()装饰器,它会根据类型注解自动创建端口并接入 Pipeline 系统;在
execute中,通过self._ports_out["OutputGdimFile"].data写入输出端口数据;更复杂的模块(如
GdimTableReader、GdimAppProjectInfoReader)也遵循同样的结构,只是内部逻辑更复杂。
端口类型与核心数据结构
在实际开发中, 模块之间几乎所有有意义的数据交换,都是通过端口 (Port) 传递「结构化数据对象」完成的。
GdiSDK 并没有直接在端口上传递 DataFrame / dict,而是通过 gdisdk.dataclass 中的一组数据结构做了二次封装,并用 gdisdk.pipeline.portTypes 中的 PortType / PortTypeHint 进行统一约定:
PortTypeHint.TableData/PortType.TableData→gdisdk.dataclass.tables.TableData带字段元数据(标题、单位、描述等)的表格数据,是绝大多数「表类端口」的基础类型(如InputTable、OutputTable)。PortTypeHint.TableCollection/PortType.TableCollection→gdisdk.dataclass.tables.TableCollection一组存在主表 / 子表关系的多表集合,常用于「一次读取多个相关业务表」的模块。PortTypeHint.SingleResult/PortType.SingleResult→gdisdk.dataclass.results.SingleResult适合保存若干关键指标(如统计结果、计算结论),方便在报告中引用或通过 LLM 进行说明。其他端口类型(如
Text、PlotData、GdimFile等)则分别对应文本说明、前端绘图数据、GDIM 文件对象等。
这样设计有两个直接收益:
对 Pipeline 作者:在声明端口类型时,不仅约束了连线是否合法,也约定了「这条线上传递的到底是哪一种业务数据结构」;
对数据智能 / 自动报告:
TableData/TableCollection/SingleResult等都包含丰富的元信息(列标题、单位、描述、表名等),比DataFrame更容易被 AI 模块理解和安全使用。
典型的模式是:
from gdisdk.dataclass.tables import TableData
from gdisdk.dataclass.results import SingleResult, UnitResult
from gdisdk.dataclass.terminologies import Units
from gdisdk.pipeline.pipeline import PipeModule, PortReference, module_decorator
from gdisdk.pipeline.portTypes import PortTypeHint


@module_decorator()
class AnalyzeTable(PipeModule):
    """对输入表格做简单统计分析。"""

    InputTable: PortReference[PortTypeHint.TableData]
    OutputStats: PortReference[PortTypeHint.SingleResult]

    def execute(self) -> PortTypeHint.SingleResult | None:
        table: TableData | None = self._ports_in["InputTable"].data
        if table is None:
            self._ports_out["OutputStats"].data = None
            return None

        avg_depth = float(table["深度"].mean())
        result = SingleResult(
            [
                UnitResult(
                    name="avg_depth",
                    title="平均深度",
                    unit=Units.m,
                    value=avg_depth,
                )
            ]
        )
        self._ports_out["OutputStats"].data = result
        return result
关于各类端口类型及其背后对应的数据结构(包括更多地学和环境专用类型、GDIM 相关类型等),可以参考专门的 端口类型 (Port Type) 章节。
创建一个Pipeline
创建 Pipeline 的过程可以理解为:
明确要解决的问题和输入输出;
创建
PipeLine对象,作为「画布 + 执行引擎」,并设置全局属性;选择合适的模块,并实例化这些模块;
使用
>>和|把模块连成一条数据处理链;运行 Pipeline,并读取结果。
下面以「沉降曲线应用」为例,展示从零创建 Pipeline 的全过程(简化自 settlementLine.py)。
步骤 1:需求分析
# 目标:
# 1. 从 GDIM 项目中读取累计沉降监测数据
# 2. 支持按多个沉降点编号筛选数据
# 3. 绘制按时间变化的沉降曲线(不同沉降点编号使用不同颜色)
步骤 2:导入模块
from gdisdk.connectors.gdimConnector import log_in
from gdisdk.modules.filters import TablesQuery
from gdisdk.modules.plotters import LineChartPlotter
from gdisdk.modules.readers import GdimTableReader
from gdisdk.pipeline import PipeLine
from gdisdk.pipeline.pipeData import TemplateVariableConfig
步骤 3:创建 Pipeline 实例并设置全局属性
pipeline = PipeLine(app_name="settlementLine", app_title="沉降曲线", version="1.0.0")

# 设置 GDIM 访问上下文(实际项目中建议使用环境变量方式管理账号信息)
pipeline.update_gdim_state(token=log_in(), proj_id="你的GDIM项目ID")

# 设置工作目录,便于统一管理输出文件
pipeline.workspace = "test"
步骤 4:实例化模块并设置参数
# 读取 GDIM 表格中的累计沉降数据
read_table = GdimTableReader(mname="ReadTable")
read_table.table_fields = ["累计沉降数据"]

# 按沉降点编号筛选数据,支持一次选择多个编号
query_table = TablesQuery(mname="QueryTable")
query_table.query_template = "`沉降点编号` in {tpl_number}"
query_table.template_variables = {
    "tpl_number": TemplateVariableConfig(
        title="沉降点编号",
        value_type="list[str]",
        schema_type="auto_select",
    )
}

# 绘制沉降曲线
plot_line = LineChartPlotter(mname="PlotLine")
plot_line.x_column = "时间"
plot_line.y_columns = "累计沉降"
plot_line.color_column = "沉降点编号"
plot_line.output_name = "沉降曲线"
步骤 5:连接模块并添加至 Pipeline
links = (
    read_table.OutputTable >> query_table.InputTables
    | query_table.OutputTables >> plot_line.InputData
)

pipeline.add_links(links)

# 可选:将模块参数提升为 Pipeline 属性,便于外部(如 GDIM 应用)统一配置
pipeline.add_attribute(
    attr_name="tpl_number",
    module_name="QueryTable",
    param_name="tpl_number",
    attr_title="沉降点编号",
)

# 可选:配置 Pipeline 运行时对外返回的结果
pipeline.return_results_config = {"PlotLine": "OutputPlotData"}
# 可选:首次加载时执行到部分模块
pipeline.initial_run_to = ["QueryTable"]
步骤 6:运行 Pipeline 并查看结果
# 运行整个 Pipeline
pipeline.run()

# 获取绘图模块的输出结果
print(plot_line.OutputHtmlFile.data)
理解Pipeline机制
前文侧重的是“如何把模块组织成一个可运行应用”,因此主要讲创建思路、典型示例和应用场景。 如果你已经会写一个基本 Pipeline,但还想进一步理解下面这些问题:
为什么
add_links()会自动注册模块,并影响子模块参数 UI;run()为什么能自动识别起点模块并向下游传播执行;add_attribute()/get_attribute_info()如何把模块参数提升为应用级属性;update_gdim_state()、workspace、return_results_config分别作用在哪一层;
建议继续阅读 运行机制 (Runtime)。
那一章只聚焦 PipeLine 的核心机制,不再重复本章已有的创建示例、UI 交互和上传流程说明。
若你的 Pipeline 需要对列表数据逐项执行同一子流程,可继续阅读 流程控制 (Flow Control)。
本章后续内容则继续聚焦 如何把 Pipeline 做成一个可配置、可上传、可复用的应用。
如何定义Pipeline的UI交互
在实际使用中,GDIM 端的用户不会直接操作每个模块的内部参数,而是通过 Pipeline 的「属性面板」来配置关键参数。因此,要让某个模块参数可以在 GDIM 中被配置,必须先通过 pipeline.add_attribute 把它映射为 Pipeline 属性。
以 沉降曲线绘制 为例(略有简化):
from gdisdk.connectors.gdimConnector import log_in
from gdisdk.modules.filters import TablesQuery
from gdisdk.modules.plotters import LineChartPlotter
from gdisdk.modules.readers import GdimTableReader
from gdisdk.pipeline import PipeLine
from gdisdk.pipeline.pipeData import TemplateVariableConfig

pipeline = PipeLine("settlementLine", "沉降曲线", "1.0.0")
pipeline.update_gdim_state(token=log_in(), proj_id="1991460394451709953")
pipeline.workspace = "test"

read_table = GdimTableReader("ReadTable")
read_table.table_fields = ["累计沉降数据"]

query_table = TablesQuery("QueryTable")
query_table.query_template = "`沉降点编号` in {tpl_number}"
# 这里采用了一种动态机制,可以将 query_template 中的变量 tpl_number 临时注册为 query_table 实例的属性
query_table.template_variables = {
    "tpl_number": TemplateVariableConfig(
        title="沉降点编号",
        value_type="list[str]",
        schema_type="auto_select",
    )
}

plot_line = LineChartPlotter("PlotLine")
# ... 省略绘图配置 ...

links = (
    read_table.OutputTable >> query_table.InputTables
    | query_table.OutputTables >> plot_line.InputData
)
pipeline.add_links(links)

# 将 QueryTable 模块的 tpl_number 参数暴露为 Pipeline 属性
pipeline.add_attribute(
    attr_name="tpl_number",  # Pipeline 的属性名称
    module_name="QueryTable", # 模块的名称,即 mname 参数的值
    param_name="tpl_number", # 模块的参数名称
    attr_title="沉降点编号", # Pipeline 的属性标题
)

# 指定需要返回给前端的结果端口
pipeline.return_results_config = {"PlotLine": "OutputPlotData"}

# 首次运行时只执行到 QueryTable,便于交互式筛选
pipeline.initial_run_to = ["QueryTable"]
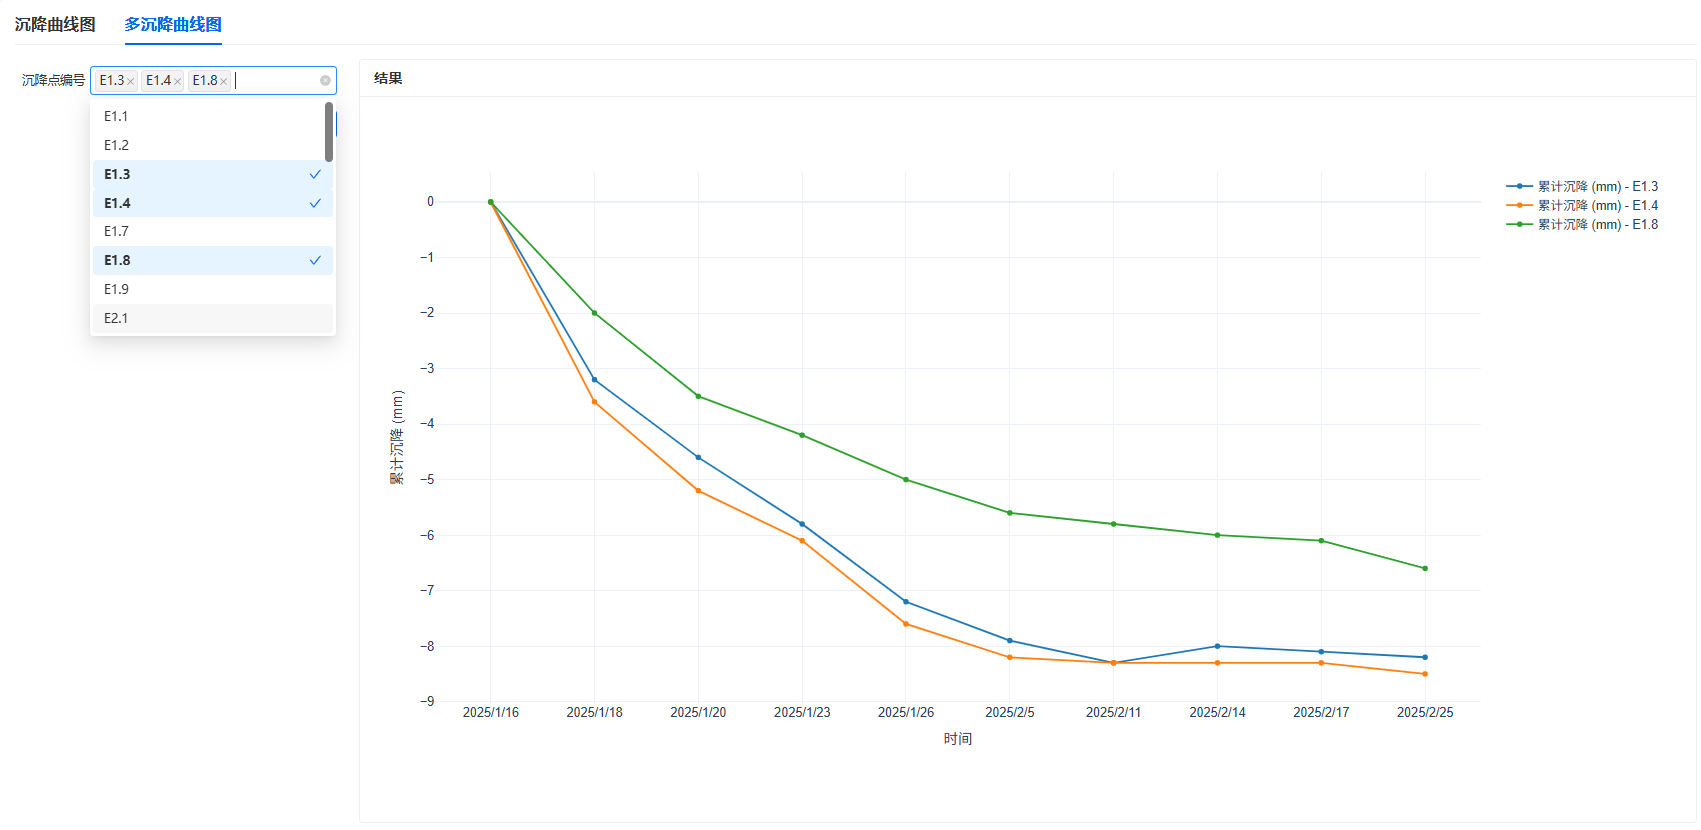
在 GDIM 前端或自定义 UI 中:
用户会看到一个名为「沉降点编号」的输入控件;
用户选择多个沉降点编号后,Pipeline 会把这些值写入
QueryTable.tpl_number;运行 Pipeline 后,
PlotLine.OutputPlotData中的绘图数据会作为返回结果展示在 UI 中。
下图即为 GDIM 中看到的 UI 效果,对于 GDIM 使用者,无需关心什么是 Pipeline 即可以得到一个友好的交互界面:
更复杂的 UI 配置可以通过 ui_schema_overrides 参数实现,例如:
from gdisdk.llm.promptTemplates import SystemDomainPrompt

# 为 LLM 分析模块配置角色选择下拉框
pipeline.add_attribute(
    attr_name="system_prompt",
    module_name="TableAnalyzer",
    param_name="system_prompt",
    attr_title="智能助手角色",
    ui_schema_overrides={
        "default": SystemDomainPrompt.GEOLOGICAL.value,
        "selections": [
            SystemDomainPrompt.GEOLOGICAL.value,
            SystemDomainPrompt.GEOTECHNICAL_ENGINEERING.value,
            SystemDomainPrompt.HYDROGEOLOGY.value,
            SystemDomainPrompt.GROUNDWATER_CONTAMINATION.value,
        ],
        "selections_name": [
            "地质专家",
            "岩土工程专家",
            "水文地质专家",
            "地下水污染专家",
        ],
    },
)
Note
为了保证在 GDIM 上可配置, 所有需要用户交互的模块参数,都必须添加到 Pipeline 属性中 ;
对于不需要在 UI 中暴露的内部参数,可以继续通过普通 Python 代码直接赋值(例如在脚本中写死某个过滤条件)。
如何上传Pipeline至GDIM
当你在本地把 Pipeline 设计和测试完成后,就可以将它上传到 GDIM,作为项目模板中的一个「应用」供他人使用。
典型流程如下:
确认 Pipeline 属性已配置完善
使用
add_attribute暴露所有需要在 GDIM 中配置的参数;使用
return_results_config指定需要返回的结果端口;必要时可以通过
get_attribute_info()检查属性结构是否符合预期。
保存 Pipeline 为 ``.pipe`` 文件
pipeline.workspace = "test"
pipeline.save_pipeline(file=f"{pipeline.workspace}/GenerateDoc.pipe")
如果只希望保存而不立即运行,可以只调用
save_pipeline,不调用run;.pipe文件是一个 JSON 格式的描述文件,包含了模块、连线、属性等全部配置信息。
在 GDIM 中上传 Pipeline
登录 GDIM,进入「个人后台」;
在某个项目模板下新增应用(如「自动报告」「数据处理应用」等类型);
在应用配置界面中上传刚才生成的
.pipe文件;按界面提示完成各章节或步骤配置,保存应用。
在项目中测试运行
基于该模板新建或打开项目;
进入应用界面,按需要填写 Pipeline 属性;
点击执行,检查输出结果是否符合预期。
Note
.pipe文件描述的是「单个 Pipeline 应用」;若需要在单个 Pipeline 内对多组数据重复执行同一子流程,参见 流程控制 (Flow Control);
当前版本 GDIM 前端对
return_results_config中配置的结果端口类型,主要支持以下几种常用类型(定义见gdisdk.pipeline.portTypes中的PortType枚举):PortType.Text:返回纯文本内容(字符串),前端以文本块或富文本形式展示 (支持 MarkDown),例如 LLM 分析结论、日志信息等;PortType.Picture:返回 Base64 编码的图片字符串,前端会解析并渲染为可视化图片(例如生成的图表截图等);PortType.GdimFile:返回 GDIM 文件对象(如生成的 Word 报告、Excel 文件等),前端通常以「文件下载」或「在新窗口打开」的形式提供;PortType.PlotData:返回绘图数据,前端会交给内置图表组件解析并渲染为交互式图表(如折线图、柱状图等)。
如何创建一个PythonCoder
在某些场景下,你希望:
直接复用一段已有的 Python 业务代码(例如复杂统计、表格转换);
又不想为这段逻辑单独写一个完整的
PipeModule子类。
这时可以使用 PythonCoder 模块 (位于 gdisdk.modules.widgets 中),它的作用是:
通过 动态端口 接收任意类型的数据(如
TableData、TableCollection等);调用外部脚本中实现的 本地函数 完成计算;
将本地函数的返回结果,写回到指定的输出端口中。
当你采用 文件方式(推荐,可上传 GDIM) 时,需要使用 gdisdk.pipeline.nameSpace.local_function 装饰器来定义本地函数:
本地函数以 普通 Python 函数 的形式编写,并用
@local_function装饰;PythonCoder 通过函数名(字符串)从脚本文件中动态加载该函数并执行;
函数返回值必须是
dict:{输出端口名: 输出数据}。
Note
PythonCoder 也支持 Inline 方式:直接把 local_function_name 设为可调用对象(函数)。
Inline 的函数 不需要 @local_function 装饰器,但无法被序列化到 .pipe 文件中,
因此如果要上传到 GDIM 平台运行,请使用上述「文件方式」。
Note
LocalFunctionProvider``(通过定义类并实现 ``run_function)属于历史兼容方案,未来版本将逐步停止使用。
本文档后续内容与示例 统一采用 @local_function 写法。
典型使用步骤可以概括为:
在 Pipeline 中创建 PythonCoder 模块并声明 输入/输出端口
为 Pipeline / 模块指定 本地脚本路径 (
local_functions_path)在脚本中用
@local_function定义函数(返回{port_name: data})在 Pipeline 中设置 ``local_function_name``(函数名字符串),然后像普通模块一样连线使用
下面给出一个「计算工程地质纵剖面总长度」的简化示例。
1)在 Pipeline 中使用 PythonCoder
from gdisdk.modules.readers import GdimTableReader
from gdisdk.modules.filters import TableSelector
from gdisdk.modules.widgets import PythonCoder
from gdisdk.pipeline.pipeline import PipeLine

# 创建 Pipeline,并指定本地函数脚本路径
pipeline = PipeLine(
    app_name="SectionLengthDemo",
    app_title="剖面总长度计算示例",
    version="1.0.0",
)
pipeline.update_gdim_state(token="你的GDIM Token", proj_id="你的GDIM项目ID")
pipeline.workspace = "test"

# 关键:指定本地函数脚本路径
# 通过pipeline属性指定可以避免有多个PythonCoder时每个PythonCoder都要设置脚本路径
pipeline.local_functions_path = (
    "test/Doc1LocationOverview.py"
)

# 读取剖面数据表
read_tables = GdimTableReader("ReadTables")
read_tables.table_fields = ["剖面数据表"]

section_lines_data_table = TableSelector("SectionLinesDataTable")
section_lines_data_table.table_name = "剖面数据表"

# 使用 PythonCoder 调用本地函数 GetSectionsLength
section_lines_length = PythonCoder("SectionLinesLength")
# 这里填写的是脚本文件中的函数名(字符串),该函数需使用 @local_function 装饰
section_lines_length.local_function_name = "get_sections_length"

# 声明一个动态输入端口和一个动态输出端口
# 端口名称需要与本地函数中读取 dynamic_ports_in 的键一致
section_lines_length.add_dynamic_ports_in("InputTable")
section_lines_length.add_dynamic_ports_out("OutputSingleResult")

# 连接模块
links = (
    read_tables.OutputTables >> section_lines_data_table.InputTables
    | section_lines_data_table.OutputTable >> section_lines_length.InputTable
)
pipeline.add_links(links)

# 运行 Pipeline 并读取结果
result = pipeline.run()
print(section_lines_length.OutputSingleResult.data)
上面的代码演示了:
如何在 Pipeline 中创建并配置一个 PythonCoder;
如何通过
add_dynamic_ports_in/add_dynamic_ports_out声明动态端口;如何像普通模块一样,把 PythonCoder 接入现有的数据流中。
2)在脚本中定义本地函数
与上述 Pipeline 中的 local_functions_path 对应的脚本(例如 Doc1LocationOverview.py)中,需要定义使用 @local_function 装饰的函数,例如:
import numpy as np
import pandas as pd

from gdisdk.dataclass.results import SingleResult, UnitResult
from gdisdk.dataclass.tables import TableData
from gdisdk.dataclass.terminologies import Units
from gdisdk.pipeline.nameSpace import local_function


@local_function
def get_sections_length(module, **kwargs) -> dict[str, SingleResult | None]:
    """计算工程地质纵剖面总长度(供 PythonCoder 调用)"""

    # 重要:PythonCoder 访问动态输入端口数据应使用 dynamic_ports_in
    table: TableData | None = module.dynamic_ports_in["InputTable"].data
    if table is None:
        return {"OutputSingleResult": None}

    sections_length = 0.0
    for _, group_df in table.groupby("剖面编号"):
        dx = group_df["x_coordinate"].diff()
        dy = group_df["y_coordinate"].diff()
        distances = np.sqrt(dx**2 + dy**2)
        sections_length += float(distances.sum())

    unit_result = UnitResult(
        name="sections_length",
        title="工程地质纵剖面总长度",
        unit=Units.m,
        value=sections_length,
    )

    # 返回值必须是 dict:key 为 PythonCoder 的动态输出端口名
    return {"OutputSingleResult": SingleResult([unit_result])}
关键要点总结如下:
脚本侧
使用
@local_function装饰一个普通函数;从动态输入端口读取数据:
module.dynamic_ports_in["InputTable"].data;返回值必须是
dict,键名必须与 PythonCoder 动态输出端口名一致(如"OutputSingleResult")。
Pipeline 侧(PythonCoder 模块)
通过
pipeline.local_functions_path或PythonCoder.local_functions_path指定脚本路径;通过
local_function_name指定脚本中要调用的函数名(字符串);使用
add_dynamic_ports_in/add_dynamic_ports_out明确输入、输出端口名称;之后即可像普通模块一样连线、运行、在 GDIM 中暴露为应用。
如果你需要更完整的参数说明(包括 debug_mode、 ui_schema_function_name 等),以及多个示例,请参考 modules.widgets 模块帮助 中关于 PythonCoder 的专门小节。
如何创建一个自定义模块
对于不需要重复在其他 Pipeline 中使用的模块,建议使用 PythonCoder 会更加简单且更容易上手,但是如果你希望这个模块可以更加通用,且需要用到其他 Pipeline 中,则建议编写一个自定义模块,并像内置模块一样放入 Pipeline 中使用。通用步骤如下:
继承
PipeModule;用
PortReference[PortTypeHint.xxx]声明端口;在
__init__中定义参数,设置_title/_description;(推荐)实现
update_ui_schema,为参数定义 UI 交互;在
execute中实现业务逻辑,读写端口数据。
下面是一个简单示例:根据阈值过滤表格数据。
from gdisdk.pipeline.pipeline import PipeModule, PortReference, module_decorator
from gdisdk.pipeline.portTypes import PortTypeHint
from gdisdk.pipeline.pipeData import FloatAttributeSchema, UIAttributeSchema


@module_decorator()
class ThresholdFilter(PipeModule):
    """根据阈值过滤 TableData 中的某一列。"""

    InputTable: PortReference[PortTypeHint.TableData]
    OutputTable: PortReference[PortTypeHint.TableData]
    # 通过类型标注声明输入 / 输出端口,IDE 和可视化编辑器会据此推断连线类型

    _port_docs = {
        "InputTable": "输入表格数据。",
        "OutputTable": "过滤后的表格数据。",
    }
    # 可选:为端口补充说明文档,用于 UI 悬浮提示等

    def __init__(
        self,
        mname: str = "ThresholdFilter",
        auto_run: bool = True,
        column: str | None = None,
        threshold: float | None = None,
    ) -> None:
        # mname 为模块在 Pipeline 内的实例名;auto_run 控制是否在依赖就绪后自动执行
        super().__init__(mname=mname, auto_run=auto_run)

        # 业务参数:要过滤的列名和阈值,都会在 UI 中暴露给用户配置
        self.column = column
        self.threshold = threshold

        # 模块在 UI 中显示的标题与简要描述
        self._title = "阈值过滤"
        self._description = "根据给定阈值过滤表格中的行"

    def update_ui_schema(self, reset: bool = False) -> dict[str, UIAttributeSchema]:
        # 这里只演示 threshold 的 UI 配置,column 可类似扩展为下拉选择等控件
        return {
            "threshold": FloatAttributeSchema(
                title="阈值",
                default=self.threshold,
                minimum=None,
                maximum=None,
            ),
        }

    def execute(self) -> PortTypeHint.TableData | None:
        # 从输入端口读取表格数据
        table = self._ports_in["InputTable"].data
        # 如果没有表格数据,或尚未配置列名 / 阈值,则直接透传输入
        if table is None or self.column is None or self.threshold is None:
            self._ports_out["OutputTable"].data = table
            return table

        df = table.data
        # 如果指定列不存在,同样选择安全地透传输入
        if self.column not in df.columns:
            self._ports_out["OutputTable"].data = table
            return table

        # 根据阈值过滤出满足条件的行
        filtered_df = df[df[self.column] >= self.threshold]
        # 复用原有元数据构造新的 TableData,保持名称、字段信息等不变
        new_table = type(table)(
            filtered_df,
            name=table.name,
            title=table.title,
            description=table.description,
            fields_meta=table.fields_meta,
        )

        # 将结果写入输出端口,供下游模块继续使用
        self._ports_out["OutputTable"].data = new_table
        return new_table
Note
在较新的模块设计中, 推荐仅使用 ``update_ui_schema`` 来定义参数的 UI 行为;
旧版本中曾通过
set_cal_params定义计算参数和范围,该方法已计划废弃,仅在兼容旧模块时可能看到, 不建议在新模块中继续使用。
如何定义模块的UI交互
如前所述,模块可以通过 update_ui_schema 方法向系统声明「自己的参数应该使用怎样的 UI 控件展示」。该方法返回一个字典:
def update_ui_schema(self, reset: bool = False) -> dict[str, UIAttributeSchema]:
    return {
        "param_name": SomeAttributeSchema(...),
        # ...
    }
其中 SomeAttributeSchema 可以是:
StringAttributeSchema:字符串参数(可配置为输入框 / 文本域 / 下拉框 / 单选框);IntegerAttributeSchema/FloatAttributeSchema:数值参数(可配置为数字框 / 滑块 / 选择框);BooleanAttributeSchema:布尔参数(通常对应勾选框);ArrayAttributeSchema:列表参数(例如多表选择、多列选择等);FileAttributeSchema:文件或文件路径选择;ObjectAttributeSchema:复杂嵌套对象;CustomAttributeSchema``(``vtype="general"):自定义 UI,不自动生成控件,需前后端约定取值结构;等等。
关于各类 UI Schema / AttributeSchema 的完整列表、字段含义以及与 GDIM 的协同关系, 可以参考专门的 UI控件 (UI Schema) 章节。简单来说:
ui schema 本质上就是为了让 Pipeline 能在 GDIM 上以「可视化应用」的方式运行而生的, 它把模块内部的 Python 参数抽象成一组结构化的表单字段,方便最终用户在 Web 端安全修改参数;
当你上传
.pipe文件到 GDIM 后,平台会读取这些 ui schema 自动生成参数面板, 并支持在管理端通过拖拽方式编排各个参数控件和结果组件的布局(分组、排序、栅格等), 从而在不修改代码的前提下构建出面向业务用户的交互界面。
以 gdisdk.modules.readers.GdimTableReader 为例,它的 update_ui_schema 根据项目模板动态生成表格名称的下拉列表(片段简化):
from gdisdk.pipeline.pipeData import (
    ArrayAttributeSchema,
    StringAttributeSchema,
    UIAttributeSchema,
    WidgetAttribute,
)

def update_ui_schema(self, reset: bool = False) -> dict[str, UIAttributeSchema]:
    # 省略 token / 模板结构获取逻辑 ...
    tables_name_selections = [...]   # 表名(内部 name)
    tables_title_selections = [...]  # 表标题(用户看到的中文)

    table_fields_schema = ArrayAttributeSchema(
        title="表名称",
        items=StringAttributeSchema(),
        depends_on="InputToken",  # 当 token 变化时,表列表需要更新
        selections=tables_name_selections,
        selections_name=tables_title_selections,
        widget_attributes=WidgetAttribute(select_enable_search=True),
    )

    table_fields_schema.widget = "select"

    return {"table_fields": table_fields_schema}
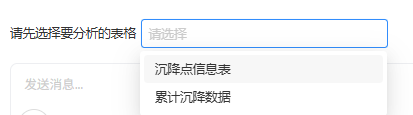
这个设计的效果是:
在 UI 中会显示一个可搜索的多选下拉框;
下拉项的「内部值」是表名(如
kl_boreholes),展示给用户的是表标题(如「钻孔一览表」);当上游
InputToken改变(即切换项目)时,表列表会自动刷新。
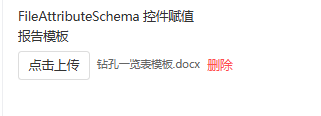
另一个简单例子是前文的 GetGdimFile 模块,它返回:
return {
    "gdim_file": FileAttributeSchema(title="GDIM文件数据"),
}
这会在 UI 中生成一个「文件选择」控件,让用户上传或下载一个 GDIM 文件。
Warning
新模块应 统一使用 ``update_ui_schema`` 描述 UI;
set_cal_params属于历史接口,仅用作兼容旧版配置,未来版本会逐步移除;若你在现有代码中遇到
set_cal_params,可以参考其中参数含义,将其迁移到update_ui_schema对应的 AttributeSchema 上。
通过合理设计模块的 UI Schema 与 Pipeline 属性映射,你可以:
在 GDIM 上自动获得一组表单控件,让非开发者用户也可以安全、可控地运行你的 Pipeline 应用。
在本地快速搭建交互式工具(例如基于 Qt / Web 的配置面板);